

WELCOME
Graphical visualization of the segmentation on depth of the Vrancea seismogenic zone
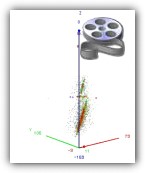
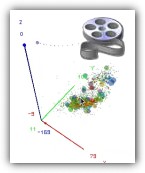
Hypocentral distribution of the earthquakes occurred in 1985-2009 time interval is approximated by two planes defined on separate depth segments (60 - 95 km) and (105-170 km), respectively.
The rotation starts from a view from SW (along planes) and ends in an oblique view from above (which emphasized once more the parallelism of the planes).
Origin of axes: lat. = 450 N, lon. = 270 E, depth = 0 km. x-axis (red): E oriented, y-axis (green): N oriented, z-axis (blue) along depth.
The curved dotted line schematically represents the Carpathian Arc position at the Earth surface.
Color convention is similar with the white light spectral decomposition: red for the most recent events - violet for the earliest events.
In "2plane.ogv", to mark the fitting plane, the earthquakes located within 1 km distance to the plane are represented by larger spheres (radius 2) than the other events (radius 1).
In "2palne_mag_gt_5.ogv", the events with magnitude larger than 5 are represented by spheres with magnitude-scaled radius.
You can download/view the movies by clicking on the images above.
Actualizari
2010-01-14
Sectiunea stiri a fost completata
Documente pentru Faza IV
Prezentare .ppt
2008-07-08
Documentele Fazei II
Sectiunea stiri a fost completata cu un raport de deplasare
 nipne.ro